Anyway, I’m a fan of two different teams, and one of them is yours. Being a huge fan of baseball and having lived here in Kansas City for 25 years now, I adopted the Royals as my second favorite team. I had to get my baseball fix somewhere, and the Royals were both convenient and good when I arrived.
I’m from Boston originally, so my favorite team is the Red Sox, and therein lies the reason why I’m writing. You see, after watching almost every Red Sox game for the past few years, as well as most Royals games that didn’t conflict, I’ve noticed a key difference between the two teams.
The Red Sox score runs. The Royals don’t.
Now, ordinarily, I wouldn’t presume to point something like this out to a man in your position. This is just one of those things you’re supposed to know, and the fans, like myself, are supposed to take them as givens. But the difference in this case is that it’s really clear that the Red Sox understand why they score runs, and they use that knowledge to guide their player acquisitions. And I haven’t seen anything that leads me to believe that anyone with the Royals has figured that out. I’ve decided that it’s entirely possible that no one in the Royals organization really understands what scoring runs in the American League is really all about, so I decided I should write you and try to explain it.
I’m going to go on the assumption that you’re an intelligent man. I don’t see much evidence that your intelligence translates to baseball, but since you’re a good New Englander like myself, I’ll give you the benefit of the doubt. Consequently, I’m going to use some math in this explanation. It won’t be terribly complex because I’m no math major, and I’ll try to make it really easy to understand by throwing in some graphs and charts, but be prepared to see some numbers.
Let’s start with a simple equation and build from there:
Runs = Getting on Base + Extra-Base Hits
Simple right? Almost too simple to even bother with, but I decided to start at this point because I don’t think anyone with the Royals really understands this. If you or anyone on your staff does know this, you clearly don’t use that knowledge when acquiring players. If you did, you wouldn’t waste any of your admittedly limited assets on the likes of Eli Marrero and Terrence Long and Ken Harvey and Angel Berroa and Tony Graffanino and a host of others. None of those guys is terribly good at getting on base. That could still be acceptable if they were good at hitting for extra-base power, but none of them do that either.
I know, they do some other thing well. They do the little things. Long is a good defensive player and has a good arm. Graffanino can bunt. Berroa can run. Marrero hits lefties. None of them hit into many double plays. The strike out but not 150 times per year like some guys. The problem is that none of the things these guys do well translates to scoring runs. None of it.
Take bunting. The Royals lead the league in sacrifice bunts, but they are dead last in runs per game. That’s not a mistake. There is absolutely no evidence that using the sacrifice enhances a team’s ability to score. Look no further than this – in the nine games in which the Royals have laid down at least one sacrifice, they are 1-8. In all other games, they are 7-15, which still stinks, but is a quantum leap over the games in which they knowingly give away one or more outs.
The same goes for steals. Not a bad tool if you can use it well, but “well” means using the steal to supplement power and on-base ability, not to replace it. Here’s one of the graphs I was talking about:
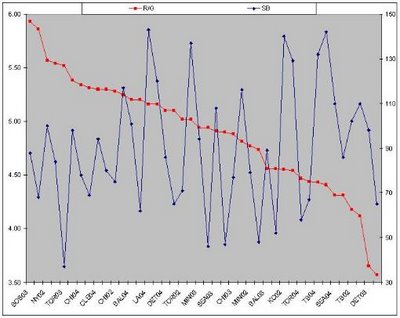
Let me translate this for you. The red line represents the runs per game figures of every team in the American league for the 2002-2004 seasons. They are in descending order, so the top left team is the 2003 Red Sox, who averaged 5.93 runs per game, and the bottom right team is the 2002 Tigers, who averaged just 3.57 runs per game. The scale for that line is on the left side of the graph.
The blue line is the number of stolen bases each team had, with the scale shown on the right side of the graph. As you can see, there is no real pattern to that line at all. If stolen bases were positively correlated to scoring runs – meaning that stealing lots of bases leads to scoring lots of runs – we would expect to see the blue line closely follow the red line. If the reverse was true – if high steal totals hurt run scoring – we would see a big “X”, with the blue line starting low on the left and moving upward as it moved right and crossed the red line.
We don’t see either. Instead we see a zigzag pattern. Some teams that stole lots of bases scored lots of runs, like the Angels in 2002 and 2004, while others scored few runs, like Tampa Bay in 2003 and 2004. Clearly, steal totals, in and of themselves, have no direct correlation to scoring runs.
Let me say that more plainly – steals alone are meaningless.
How about those bad things that your players currently avoid? Take strikeouts for example. Supposedly, striking out is one of the worst things a hitter can do. It would follow that any team that strikes out a lot will be prone to lower run totals, right? Actually, that’s not the case:
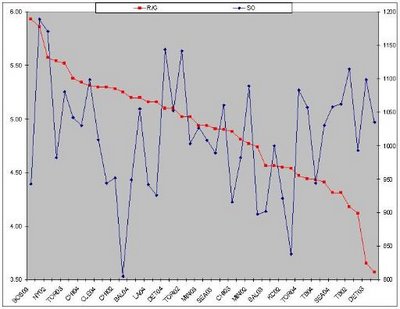 Pretty much the same graph as steals, isn’t it? The red line is runs per game again, exactly the same information as in the first graph. This time the blue line represents each team’s strikeout totals. Again we see the random zigzag pattern. Look at the top two scoring teams of the last three years, the Red Sox of 2003 and 2004. In ’03 they collectively struck out just 943 times. The very next year they added almost 250 K’s to that figure, yet they scored almost exactly the same number of runs per game (5.93 in ’03, 5.86 in ’04) and won the World Series. Last year’s champs had the highest team strikeout total (1189) in this three year period. The lowest total was the 805 strikeouts of the Angels of 2002, a club that also won the World Series and was fourth in the league in runs per game.
Again, there is no correlation between striking out and scoring runs.
Grounding into double plays is another traditional taboo for an offense. It’s generally considered to be even worse than striking out, because not only is the batter out but a baserunner is out as well. It’s commonly called a “rally killer”, so a high double play total must have a terrible impact on a team’s ability to score. At least, that’s the conventional wisdom. The trouble is that it’s just plain wrong. More graphs…
 More zigzags. You’d see similar zigzags if I threw in graphs on sacrifices, or other “small ball” ratios, but I hope you get the point by now. These “little things” don’t directly translate to runs. That doesn’t mean they’re bad. No team should ever refuse to attempt any steals or sacrifices, or should wantonly whiff or ground into double plays. As individual events, a steal or sacrifice is still a valuable thing in some situations, just like a double play or strikeout is still a bad thing in certain circumstances. But, in totality, being good at these little things won’t result in more runs unless they supplement the real building blocks of offense.
And, as I said earlier, those building blocks are really simple – get on base and hit for extra bases. Batting average alone won’t get it done. It has a positive correlation to run scoring, but that’s deceptive for two reasons. First, batting average is really just a subset of getting on base. You can hit .300 all day long, and it will look great on the back of your baseball card, but if you never draw a walk and never get hit by a pitch, your on-base percentage will also be .300, and that just stinks.
The second reason it’s deceptive is because the correlation simply isn’t that strong when compared to the real drivers. Here’s the batting average graph:
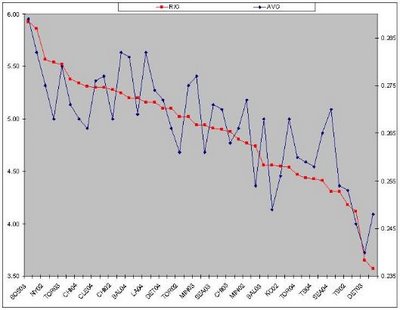
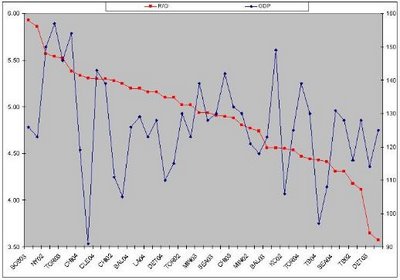
Obviously, there’s a relationship here, particularly when compared to the small ball graphs. There is a general trend indicating the as team batting average drops, so does team run scoring. But notice how that blue line hops up and down? Some of the swings are pretty far removed from the red run-scoring line, so the relationship here might not be the tightest. Compare it to the graph for on-base percentage:
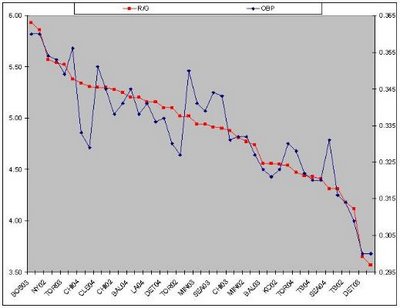
I could start throwing out some more obscure statistical terms like p-values and whatnot, but I don't want to confuse the issue. Trust your eyes and look at the graphs. This is obviously a much closer relationship. There are still swings between points, but at roughly half of the points the two lines are almost on top of each other. It’s obvious that the more a team collectively gets on base, the more runs they tend to score.
The same can be said for slugging percentage, which is the best representation of a team’s ability to hit for extra bases:
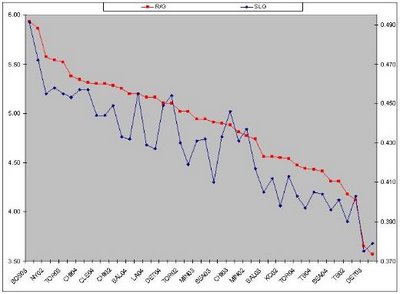
Again, there are some swings, almost as many as on the batting average graph, but overall it’s still a strong trend.
Now let’s put the two together. A relatively new statistic, OPS, is nothing more than a team’s (or player’s) on-base percentage added to its slugging percentage. When this number is compared to runs per game, the strong relationship is clear:
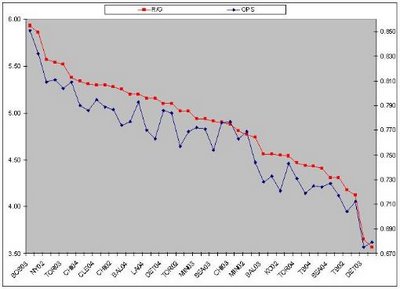
Reasonable swings from point to point, with no glaring exception to the general rule that the higher a team’s OPS, the more runs they will score. This is the strongest correlation yet, making it obvious that a combination of on-base ability and extra base power is the surest route to scoring runs in the American League.
Does that play out for your team this year? Sure it does. Just look at your team’s performance sorted by these various measurements. When the Royals draw two walks or less in a game, they are averaging 2.94 runs per game and have a record of 2-14 (.125). When they draw at least three walks in a game, their scoring average jumps to 4.53, and their record is 6-9 (.400). None of those marks are good, but clearly it’s better when the team is walking than when they aren’t.
The same trend reappears when we look at extra-base hits. When they Royals have only two extra base hits or less in a game, they average just 1.67 runs per game and their record – hold on to your hat – is 0-15. That’s a .000 winning percentage in case you were wondering. When the Royals get three or more extra base hits in a game, they average 5.63 runs per game and have a record of 8-8 (.500). See the pattern?
How about if we combine them? When they Royals draw at least three walks and have at least three extra base hits in the same game, they average 5.64 runs per game, and are a .545 ball club, with a record of 6-5. When they have the same three walks but at least 4 extra-base hits, they are a sparkling 5-1 and average 7.33 runs per game.
Now, if you have a researcher on your staff who is supposed to be looking at this kind if information for you, you might know that the Royals score better when they steal, too. Or when they have a sacrifice bunt, for that matter. That’s absolutely true, but don’t be misled. You see, in statistics there’s this thing called “confounding”, which is just a fancy term used to describe a situation where some other, unexamined factors are presents that make the thing you are examining look different than it really is. In the case of steals, for instance, I could make this completely true statement:
“In games in which the Royals stole at least one base, they average 4.56 runs per game. In all other games they average 3.36 runs.”
Absolutely true. But here’s the confounding part – look at those games more closely and you’ll find that in five of them the team also had three or more extra base hits. In the games in which they stole at least one base and also had three or more extra base hits, they averaged 6.4 runs (and posted a 3-2 record); in the games when they stole a base but had less than three extra base hits, they averaged just 2.25 runs (and posted a 0-4 record). So was it the steals that produced the runs or was it the extra base hits?
And let’s not forget the reverse side of the stolen base equation. The Royals have been caught stealing as many times as they’ve been successful. Your research might point out that in those games in which the team has been caught stealing at least once, they average more runs per game (4.09) than they do in the games where they weren’t caught stealing (3.50). Some might look at that from the small-ball perspective and say, “Well, it’s because by running we put pressure on the defense, so even though we got caught stealing we pressured them into mistakes in other parts of the game.”
I say, “Hogwash”. Look at the extra base hits again and you’ll see that in most of the games in which the team had at least one runner thrown out trying to steal, they also had three or more extra base hits. In those games, they average 5.25 runs. In the remaining three games, in which they were caught stealing at least once and also failed to manage at least three extra base hits, they scored just one run in each game.
Or look at it this way; In games in which the Royals had three or more extra base hits, but also wasted at least one out by being caught stealing, they were just 3-5 (.375) and scored 5.25 runs per game. In all other games when they had three or more extra base hits, but didn’t needlessly run into an out on the basepaths, they scored more (6.0 runs per game) and won more (5-3 record). Running just doesn’t help unless there’s some power to back it up, and running into extra outs, even when the team is hitting for power, actually hurts a team’s ability to score.
Here’s another one:
“In games in which the Royals laid down at least one successful sacrifice bunt, the team has averaged 4.33 runs per game. In all other games they have averaged just 3.45.”
So sacrifices are good, right?
Nope. In six of those nine games, the team also had three or more extra base hits, and averaged 5.00 runs in those games. In the three remaining games in which they laid down one or more sacrifices but didn’t have at least three extra base hits, they scored a total of nine runs, an average of just 3.00.
Or look at it this way; In games in which the Royals managed three or more extra base hits, but also gave away at least one out with a sacrifice bunt, the team still scored well – 5.0 runs per game – but posted a 1-5 record. In all other games in which they had three or more extra base hits but didn’t waste an out by bunting, they scored more (6.0 runs per game) and won more (7-3 record). So it should be pretty clear by now that these sacrifice bunts are dragging down the offense, not helping it.
And I guess that’s pretty much my point in all of this. The Royals collectively, and Tony Pena particularly, seem to have no real grasp of the things that lead to runs. Some of that might be attributable to the fact that the players collected here aren’t the biggest boppers in the world, so Pena and others feel like small ball is the only way to go. There is some truth to that, but not much. This collection of players wouldn’t be good no matter how well Pena used them, but his game strategies are actually taking precious runs away from a team that can’t afford it. Please, I beg you, stop him.
And as for your role in this, please try to keep some of these figures in mind as you put the team together. I mean, what, exactly, is Ken Harvey doing to help this team win? He has a .678 OPS comprised of a .389 slugging percentage and .289 on-base percentage. That’s awful. Do you realize that Mark Bellhorn, who is working for his fourth team, is generally recognized to be the worst hitter in the Red Sox daily lineup, regularly bats ninths and has failed to hit a home run this year, has a better OPS than Ken Harvey, who Tony Pena regularly bats cleanup? Do you realize that there are only three players on the Royals – Mike Sweeney, Matt Stairs and Joe McEwing – who get on base at a better rate than Bellhorn?
And recognize that this has nothing to do with money. Bellhorn makes only $2.75 million. Last year, when he was truly valuable, he made about $500,000. Both of those figures should be well within the Royals’ budget, and Bellhorn was available for any team to sign prior to last year. The Red Sox just happened to be smart enough to realize that they could have Bellhorn cheap, that his on-base ability would be valuable even if he did lead the league in strikeouts (which he did), and that his versatility (a switch-hitter who has played every position except pitcher and catcher) would actually save them money by allowing them to keep an inexpensive rookie, Kevin Youkilis, on the roster for most of the year and develop him slowly.
The Red Sox are currently the best at recognizing how offense really works. Yes, they have enormous resources, and they used them to sign Manny Ramirez and Johnny Damon. They also get to keep the players they develop themselves, like Jason Varitek. But almost half of that lineup is full of guys no one else wanted. Bill Mueller, Mark Bellhorn, David Ortiz, Kevin Millar - all free agents that the Red Sox signed for low dollars because they fit their style. The same goes for their homegrown talent, Varitek and Trot Nixon. Every one of those guys is patient and they all have extra-base power. That doesn’t mean they hit 30+ homers each year, though Ramirez and Ortiz certainly do. But you don’t need three or four guys hitting 30 homers each if everyone in the lineup is hitting 15 or more. And if everyone in the lineup is willing to draw a walk, they don’t have to wait for solo homers anyway; they can score with a walk and a double.
Those skills are affordable. The Red Sox didn’t pay most of those free agents much at all. Yes, they pay the likes of Manny, Varitek and Curt Schilling a lot of money, but the majority of the team is made up of players they Royals could have afforded. It’s about concentrating your dollars where it matters. Do you recognize that for the same money you are paying Terrence Long, you could have signed Jeromy Burnitz, who currently has a .518 slugging percentage for the Cubs? Do you realize that you could have a lineup of David DeJesus, David Dellucci, Mike Sweeney, Jeromy Burnitz, Matt Stairs, Joe Randa, Gregg Zaun, Mark Grudzielanek and Angel Berroa for the same amount of money you currently pay for a lineup of DeJesus-Graffanino-Sweeney-Stairs-Long-Marrero-Berroa-Buck-Teahen? That first group is comprised of four current Royals, one Royal who left in the off-season, Randa, and four guys who were free agents this year. They are hitting a combined .280, with a .365 on-base percentage and .479 slugging percentage. The second group – an actual Royals lineup several times this year - is hitting a combined .242, with a .304 on-base percentage and .397 slugging percentage.
Same money, wildly different results. And that’s because the first group includes players at most positions who either get on base a lot, hit for power, or do both. Even then, it can carry a couple of younger players who currently aren’t hitting that well, DeJesus and Berroa. We could have even substituted John Buck for Gregg Zaun, saved money compared to our actual lineup, and still posted impressive combined numbers - .270 average, .350 OBP, .462 slugging.
I hope you are beginning to see how this works. Forget about speed and whether or not they strikeout a lot. Draft or sign hitters who are patient and who drive the ball when they make contact. If they can run and field on top of that, great. If not, sign them anyway, because it’s a whole lot easier to find a cheap defensive specialist than it is to find someone who walks 80 or more times while he’s hitting 20+ homers. You can carry a couple of field-first guys in the lineup if you are getting the production you need elsewhere. If you’re not, it doesn’t matter how well the team collectively catches the ball, or runs or bunts, they won’t score.
And in the American League, if you can’t score, you can’t win. I sincerely hope these numbers make that abundantly clear.
If they don’t , God help all of us poor Royals fans.
Regards,
Paul White


